
Suppose you and I have arranged to meet for lunch at The Dome in Edinburgh on Friday. You’re already there, but I’m not. You know I’m driving up from Sheffield, so you call to find out when I’ll arrive.
I say: “I’m doing 65 miles an hour, and I expect to be up to 70 in a couple of miles.”
That may be interesting, but it isn’t what you asked. You wanted to know where I am and when I’ll get there, and all I’ve described is how fast I’m going.
Yet this is more or less how businesses describe growth. “We’ll do 15% a year for the next three years” is a speed, not a destination. You might reasonably say that 15% for three years is a destination of sorts, because it means the business ending up about half as big again. But a destination isn’t wherever your current speed happens to carry you. You wouldn’t plan a family day out based on a circle around your house that you could reach at a given speed. A destination is somewhere you choose, and then build the journey around.
Most growth plans are the first thing, presented as the second.
A while ago I became curious about how UK businesses are distributed by turnover. Since the advice needed to run each part of a business to a decent standard is affordable and widely available, and you’ll find advisers of every kind at every networking event, you’d expect businesses, on average, to get bigger over time.
What we find is different. To take one example, of around 2.8m UK businesses, only about 3% report turnover above £5m. One in 34. That figure is a snapshot rather than an individual life story: it illustrates how many businesses sit either side of the line at a given time, not how many ever cross it.
What gives this proportion significance is that it hardly moves. Take the same measurement in every edition back to 2018 and the answer comes out close to the same each time, pandemic years included. It drifted over the period, from one in 44 to one in 34, but almost all of that is the threshold rather than the businesses: £5m today is worth about a quarter less than it was in 2018.
That is the finding. Not that a business can’t get past £5m, but that the proportion above it is held near one in 34 by something that hasn’t shifted in nine years.
Before going further, I should say that £5m is only where I happened to stop. Nearly nine in 10 UK businesses are under £1m. One in nine is above it, one in 34 is above £5m, one in 62 is above £10m. Nothing special happens at any of those lines. £5m is simply the example I’ll use here.
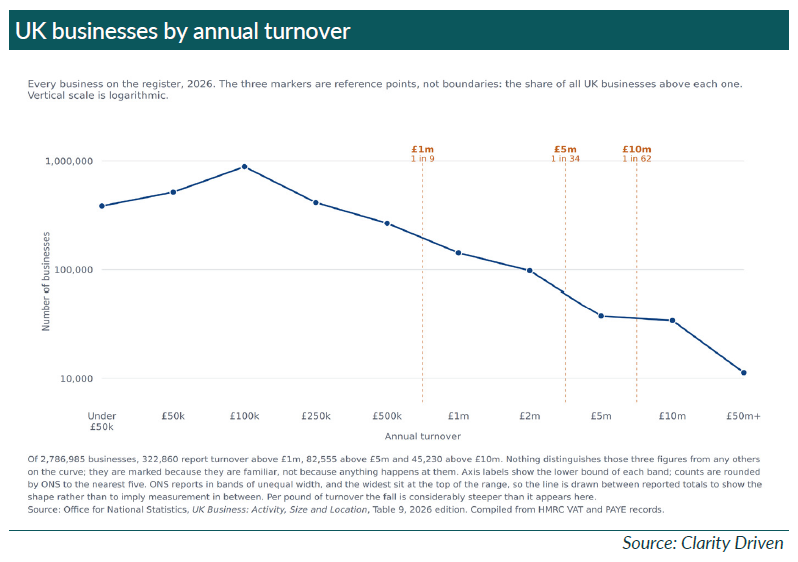
The shape of the curve matters more than any of the data points. There’s a peak among the very smallest businesses, which is a story of its own. Above it, band by band as turnover rises, each group is smaller than the one below.
That shape could be an artefact of how the given bands are drawn. ONS uses narrow bands at the bottom of the range and very wide ones at the top, which distorts the upper end. To address this, if you divide each band by its width in orders of magnitude, the distortion disappears. What’s left, from £100k upwards, is a straight line on both-log axes in every one of the nine years.
A straight line there means the rate of decline is constant across the whole range. Each tenfold step up in turnover divides the number of businesses by between six and seven, and it does that as reliably between £100k and £1m as it does between £5m and £50m.
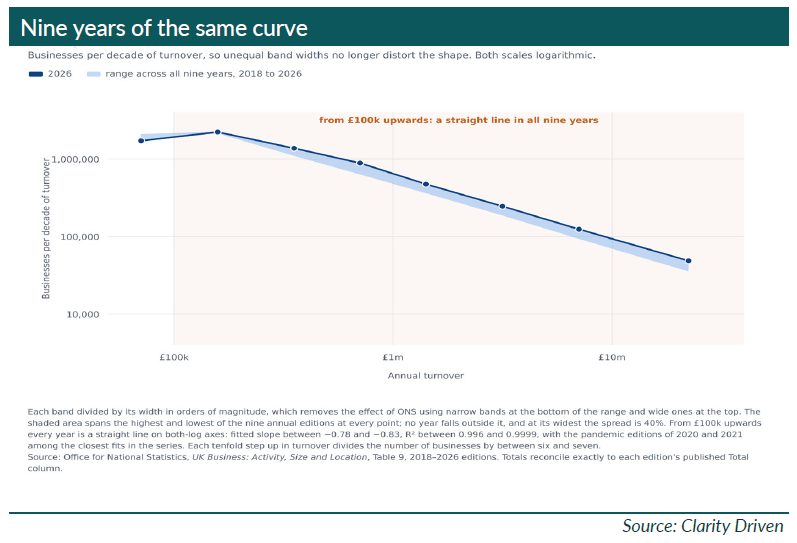
I’d offer that as an interpretation rather than a refutation of other theses. The familiar account of stalling is that businesses meet characteristic barriers at characteristic sizes; however, in that case, you might expect barriers at particular turnover figures to leave a mark here. They may well exist and simply vary enough between businesses and sectors to average out. But nothing in this shape requires them. A single condition applying equally at every scale produces exactly this line.
I’d offer all of this as consistent with an explanation rather than proof of one. It’s national and high level, a series of snapshots, and anyone who wants to test it can plot it themselves from ONS Table 9.
To be clear, some of that curve is a function of businesses that didn’t survive, some will be good ones that were acquired and left the chart, and some owners who’d already reached the scale they wanted. But the raw data shows most population churn happens among the youngest and smallest firms, and takeovers run at around 900 domestic deals a year against a population of nearly 3m. Among businesses already large enough to grow, those with 10 or more employees, only about one in 20 meets the international measure of high growth, 20% a year for three years. Strip all of that out and a very large number remains: capable businesses, run by capable people, in decent markets.
So, for the most part, these aren’t businesses that fail. They stop. And stopping doesn’t mean standing still, because most will still be growing, just at rates not far from inflation. That is worth a name, because it is a distinct condition and we don’t currently have one for it. Call it ‘growth by default’: the rate a business arrives at when all the work went into the number and none into the company that would produce it.
Ask a business why it stopped growing and you might hear a range of reasons around finance, or management bandwidth, or innovation, or soft demand, or even a lack of ambition. Every one of those may well be real, and each one can be justified in isolation.
However, what’s worth noting is how little the answers converge. The ScaleUp Institute’s 2023 survey of 306 scaleup leaders put access to markets first, at 64%, talent second, at 58%, and growth capital third, at 38%. The government’s Longitudinal Small Business Survey, asking SME employers much the same sort of question in 2025, produced a quite different list: taxation at 67%, energy prices at 52%, regulation at 47%. Obtaining finance came 12th, at 16%.
Different populations and different question wording account for some of that. But it’s the lack of convergence itself that’s the point. It is what you would expect if the various reasons being named were an outcome rather than a cause. To put it another way, they are the wall the business hit, not the reason it was travelling towards it.
The root of this, so far as I can see, is that a measurement system has ended up being mistaken for a method. Growth gets described almost universally in forward-looking, incremental terms, by advisers, lenders and investors alike. Since this is the lingua franca, businesses subsequently attempt to use it to build their plans. We can call the result ‘rate-first planning’, which, given the apparent results, is a generous name for it. A percentage is how you compare one business with another, value them, or track what has happened, and for every one of those jobs it is the right instrument. But all of those views look backwards. Everything a percentage measures has already happened.
Using a percentage to describe next year becomes less useful. A rate tells you how fast something needs to move. It can’t tell you what has to be built, or what has to start now so that it exists in three years, because those aren’t measurements, they’re decisions. So rate-first isn’t a weaker way of planning – it isn’t really planning at all. It’s last year’s measurement extended forwards and called a plan, and since plans expressed that way look broadly alike, there’s nothing in particular to notice about the method.
There’s one place where a rate legitimately points forwards, and it’s worth separating out. A lender or an investor requiring a given return over a given period isn’t planning anything. They’re setting a condition, and a percentage is the right instrument for it, because what’s being specified is an outcome, not a route. The difficulty is what happens when that number gets communicated. It reaches the client business with the authority of the people providing the capital, and the business, reasonably enough, divides it by the years and aims at it. In that scenario, a requirement has become a plan but the end state company capable of producing the number still hasn’t been described.
Plans built that way also appear better evidenced than they are. A percentage target refers to last year’s performance, and while last year feels like data, it isn’t evidence about next year. A plan that assumes next year resembles last year is making a claim about the market, and that claim is rarely written down anywhere it could be challenged.
A growth increment is rarely asked to justify itself the way a stated destination would be, so the assumptions underneath it, about the market, about customers, about capacity, are not necessarily robustly tested.
It’s also worth highlighting that a bare growth rate means whatever the reader brings to it. The same modest number that feels like prudence to the business owner who set it may look like a lack of appetite to the investor reading it, and neither can prove the other one wrong, because nothing has been described that would settle it.
When the number is then missed, the only explanation available is another number. It would be hard to complain that a new factory was commissioned two years late if nobody ever said a factory would be needed.
What strikes me most, in the businesses I work with, is that an alternative has usually never been put to them. There are two ways to build a plan. You can start from where you are and project forward, which is rate-first, or you can start from where you intend to be and work backwards, which is destination-first. This second method isn’t, so far as I can see, routinely taught. So rate-first isn’t the preferred method. It’s the only one most leaders have ever encountered.
I should be clear what I mean by ‘destination’ in this context: a fully detailed description of the business at target scale in a multi-year time frame. Not just a turnover number, but all the supporting operational and financial metrics that generate one.
With a clearly defined destination, a business is more able to identify the large, pivotal decisions that over time turn a small company into a large one, which in turn enables it to know when they have to be made.
Everything that enables sustained growth has a long lead time. Larger premises, a new factory say, might be two years, and that’s if the planning goes your way. A senior hire is six months to find and perhaps another six before they are fully effective, while developing someone internally is three or four years. The new system that runs the business is a year to put in, and another before anyone trusts the numbers it produces. Accreditation into a new supply chain could easily be 12-18 months. The corporate customer who needs your brand-new product doesn’t buy when you’re ready. They buy when their budget cycle comes round, which means the ideal time to start selling your solution to them was two years ago, just after they bought your competitor’s.
There’s a second cost on top of being late. None of those things are done well in a hurry. To take a personal example, I spent a year inside a management system project, and I can tell you they’re not ruined by the technology. They’re ruined by being deployed against the clock.
My contention is this. A business working rate-first, 12 months ahead, won’t meet any of these early enough. It meets them when it’s already running at full capacity, which is the one moment when none of the right answers are much help, and then it acts in a hurry, which is how expensive things get done badly.
Let’s go back to our original example, meeting in Edinburgh. If I’d known I was driving from Sheffield right into the middle of Edinburgh, I’d have worked out where to stop for fuel before I set off. Not knowing, I’m likely to have to make the decision in a rush when the warning light comes on, 40 miles past the last services.
A well-defined destination changes the questions. Suppose a business commits to doubling turnover in three years. That’s real, and it’s a long way off, but it’s still only a direction of travel. There are many ways to double a turnover: sell more of what you already sell, sell something new, go somewhere new, or buy somebody. From the same starting point those four routes build four quite different companies, and until you know which one you’re building, the turnover figure on its own isn’t much use as a guide.
If, on the other hand, you reinforce a target turnover with an in-depth description of the business at scale, your direction becomes a destination, and the planning becomes destination-first. Taking those four different routes as the example, each of them can now be described in detail: broadly, what each would need and approximately what that would cost. None of it is certain, but all of it can be sized, and all of it can be checked.
That matters, because the commitment is a real one. Choosing a destination means accepting that the business you have today may not be the business that arrives, and that getting there might mean spending money you haven’t earned yet, on a journey you’ve never made, based on a belief about a road you don’t know. For an owner the stake is the whole business: livelihood, pension, quite possibly the house it’s secured against. Nobody should take that on blind. A destination that has been described can be examined before it’s chosen, and that’s the difference between a decision and a gamble.
Most businesses don’t fail to grow. They grow by default. Working rate-first, no destination is ever chosen, so the decisions that would have carried them somewhere in particular never come into view, and the rate they reach is whatever is left when nobody has decided where to go. They didn’t consider the alternative and reject it. They were never shown it.
While planning for 2027 is well under way, a question worth putting to any business, your own or one you’re looking at, isn’t how fast it intends to grow in the next 12 months. It’s where it intends to be at the end of 2030, and how it plans to get there. The ones that can answer that with evidence, and in detail, are the ones worth watching.
Sources cited in the body
► ScaleUp Institute, Scaleup Survey 2023 (306 scaleup leaders), scaleupinstitute.org.uk
► Department for Business and Trade, Longitudinal Small Business Survey 2025: SME employers, gov.uk
► Office for National Statistics, UK Business: Activity, Size and Location, Table 9, 2018–2026 editions
► Office for National Statistics, Consumer Prices Index, for the real-terms value of the £5m threshold
Jonathan Cozens is the founder of Clarity Driven and the author of Clarity Driven: How To Get It Right When You Can’t Know It All (2025).
His background is more than four decades of operations and leadership across broadcast, technology and enterprise services in the UK, Europe, the USA and Australia, including seven years founding and running his own technology services company.
He now works with founder-led businesses on business planning and evidence-based decision-making. Through his 3x in 3y programme he helps owner-leaders build their own three-year plan for tripling the business. He spoke on the subject of this article at The Investors’ Circle, hosted by Hardman & Co and WW Investment Services, in October 2026.