
Financial data from over 100 multinational drug companies have been accumulated over the past 35 years to create a pharmaceutical database. However, a significant level of industry consolidation means that the data for the latest year, 2021, is derived from just 40 companies, which command an estimated 76% share of the global Rx drug market. All our data have been derived from annual reports, regulatory filings and company presentations, and then analysed, wherever possible, in a like-for-like manner, irrespective of how each company presents the data. This is a key differentiator to competitive products, and is important because all company management teams report “adjusted”, “core”, or “non-GAAP” earnings to show themselves in the best possible light. However, different inclusion/exclusion criteria in the generation of these adjustments lead to distortions and variability.
Although some of the companies are multi-divisional, another key differentiator in our analysis is the extraction of data for the pharmaceutical segments only. We have no allegiance to any company, making our analysis truly independent.
While there are some other products available that generate drug and company rankings based on sales data, this product is unique because it analyses each of the individual cost components of the business – cost of goods sold (COGS), selling general and administration (SG&A) and research and development (R&D) – which generates pharma industry weighted averages, and allows peer comparisons to be made. It also generates individual company and industry-wide underlying operating profits (EBIT), both pre-R&D and post R&D.
In order to compare data for acquisitive companies with those that have grown organically, amortisation of goodwill is added back into audited numbers. However, it is important to know just how much of shareholders’ money is being written off each year – so data on amortisation and impairment charges are shown separately.
Historically, the manufacturing side of the industry was very inefficient, and high gross margins on small molecule drugs meant that little attention was paid to COGS. However, more complex processes involved in the manufacture of biopharmaceutical drugs forced an improvement in manufacturing efficiency. The weighted average COGS for the pharma industry in 2021 was 25.7%.
The industry approach to marketing has been evolving to reflect a changing market place. In addition, companies that embark on M&A activity look to downsize the number of sales reps to generate leverage from the additional sales. Consequently, the biggest reduction in costs has been seen with the SG&A line, from an industry average of about 37% in the 1990s to 23.9% in 2021.
In our opinion, the boards of all companies should want to know how their performance compares, on a like-for-like basis, with the industry average and against their peers. The weighted average pharma industry EBIT in 2021 was 32.5%.
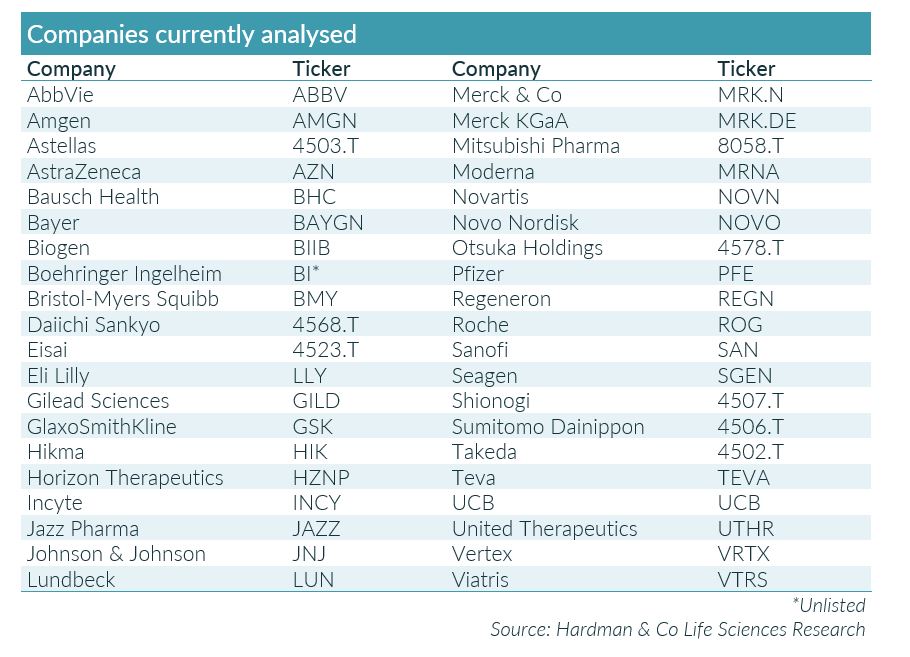
Our pharmaceutical database has been compiled, as far as practically possible, in a like-for-like way from company reports and regulatory filings since 1985. Over this period, data from over 100 companies have been complied, but, due to industry consolidation, the latest year is based the 40 companies listed in the following table.
This report is available for purchase at £10,000 (plus taxes where appropriate), or the equivalent price in USD ($12,500), EUR (€12,000) and JPY (Y1.6m).
If you’d like to contact us for more information, please email: [email protected]