Asset managers had a poor 2022: the S&P Composite 1500 Asset Management Index was down 22% and, according to the Investment Company Institute (ICI), worldwide mutual funds fell by 20%, from $76tr to $60tr. When bond and equity markets fall, the results are unlikely to be pretty: with revenues trending down and multiples contracting, there is a double whammy to contend with.
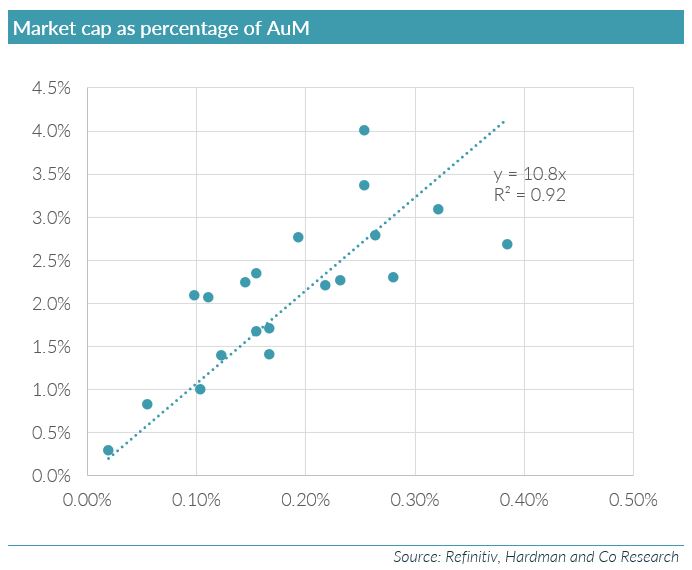
So how do valuations shape up now, after a bullish start to the new year? The chart below is my favourite chart of asset manager valuations – it has so much information in it. The x-axis is the EBITDA as a percentage of assets under management (AuM), and the y-axis is the market cap as a percentage of AuM. Thus, a line drawn from the intercept out is the market cap/EBITDA ratio.
There are 20 companies represented on the chart, which we can group into three categories: asset managers, platforms and wealth managers. But even as one group, the line of best fit has a correlation coefficient of 0.92, and its gradient is a market cap/EBITDA of 10.8x.

The two biggest outliers are Man Group and Ashmore. Man Group is below the line on the far right. In simplistic terms, it is “cheap”: it has the highest EBITDA/AuM margin, at 0.38%, and a middling valuation, at 2.7% of AuM. This is almost certainly explained by its very high proportion of performance fees. At the last reporting date, for the half year to June 2022, it made $469m of management fees and $404m of performance fees. Ashmore, on the other hand (above and to the left of the line), is “expensive”, with a high-ish EBITDA/AuM margin, at 0.25%, but the highest valuation by assets, at 4.0%. This is due to a combination of two things: a very high proportion of cash and investments in its market cap (110p at its June 2022 year-end, out of a 270p share price) and its very strong run in the past three months (up 50% from its mid-October low). If the consensus estimates do not follow the upward movement of the share price, Ashmore could begin to look vulnerable.
Download the full report