Prior to the worst part of the UK credit crisis, which saw the collapse of Northern Rock and the combined near £66bn taxpayer-funded capital injections into RBS and Lloyds, the housebuilding sector had enjoyed a solid era of growth – reflected in decent share price growth. Thereafter, confidence in the sector dipped although it did recover very strongly in the lead-up to the COVID-19 epidemic in 2020 – and indeed briefly thereafter. However, higher interest rates subsequently – and the ending of the Help to Buy scheme in 2023 – have curbed sector growth, a fact amply reflected in the recent poor sector share price performance.
The high-profile, five-year 1.5m new-build target of the Labour government has now become more of an aspiration than an achievable target. For various reasons, the number of new house-build units has remained well below the 300,000 figure that is required to achieve this end. Historically, too, this target is distinctly ambitious – you need to go back more than 50 years or so for such numbers to be delivered regularly.
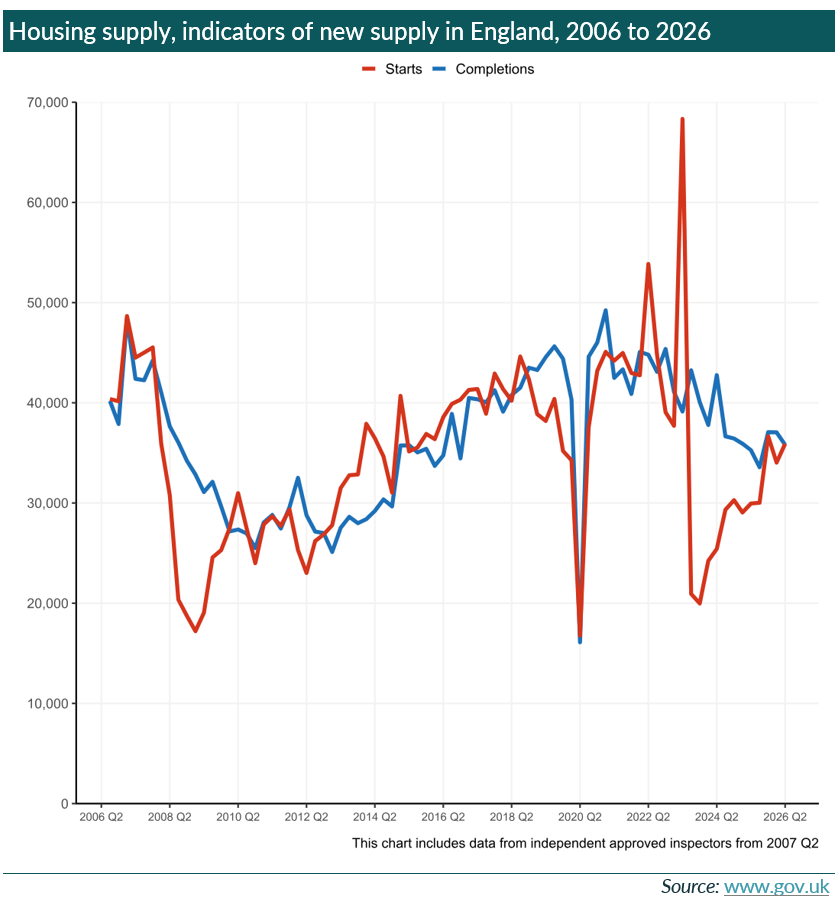
The bar chart, below, published by the Ministry of Housing, Communities and Local Government, highlights the number of housing start-ups and completions in England since 2006: the volatility of the numbers is also pertinent for potential investors.
Despite the demand for new homes, driven in part by immigration, macroeconomic factors remain a potent deterrent for new house buyers. With abiding concerns about the UK economy, notably regarding the £3tr net debt figure and probable tax rises in next month’s Budget, many potential buyers remain cautious. Indeed, many may prefer to rent properties – and forgo the chance, at least for the present, of home ownership.
Of course, future trends in UK interest rates are pivotal in driving sales of new-build houses. Until relatively recently, it was widely expected that interest rates would fall from their current 3.75% level. Instead, at least one and probably more rises are expected unless the Hormuz oil access issue is satisfactorily resolved – or, indeed, oil prices fall. Rising inflation, irrespective of the oil price driver, is also a highly relevant interest rate factor.
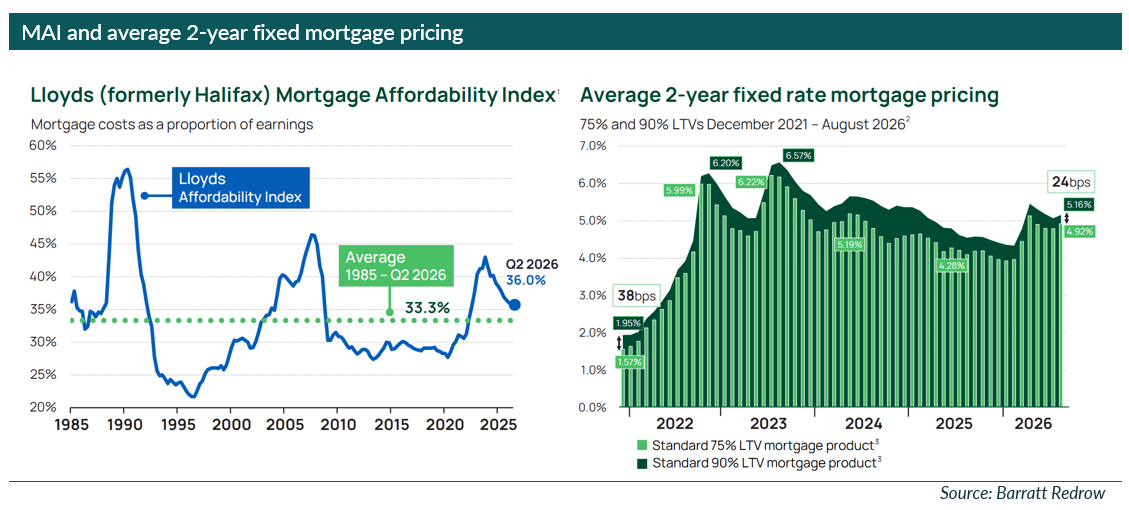
More specifically, the two charts below, published by Barratt Redrow, show the sector Mortgage Availability Index (MAI) data, along with comparable pricing information. Undoubtedly, considerable volatility is in evidence, especially in the sharp increase in the average 2-year fixed mortgage rate from the spring of 2022 to the autumn of 2023 – up from just 2% to more than 6.5% in only 18 months. The MAI calculation is based on i) assessing standardised average housing prices; ii) incorporating average disposable earnings for full-time employees; and iii) using the Bank of England’s monthly average data for new mortgage advances to householders.
Within the sector, housebuilding inflation remains an issue. The latest figures published by Barratt Redrow are projecting a Building Construction Index (BCI) figure of between 3% and 4% for materials and a 2% to 3% for labour: the cost base is split broadly 60%:40%, with the higher percentage being materials-related.
Download the full report